User Interface and Reports
Get the best out of your trading experience with our intuitive UI and in-depth reportings.
Wyden frontend
- Fully configurable tables showing current orders, market data subscriptions, positions, cash balances and transactions with support for (multi-column) sorting, filtering, and exporting
- Interactive order placement form with full-text search for instruments and configurable order presets
- Support for multiple workspaces based on a customizable widget system that allows you to add, remove, re-arrange and re-size individual widgets
- Advanced order placement form to initiate execution algos using the integrated Smart Order Routing
- Algo order state display showing the current state and child orders of each execution algos
- Configurable tiles showing financial metrics like NetLiqValue, Unrealized P&L, Cash, etc.
- Portfolio selection drop-down to select an individual portfolio or an aggregated view over multiple portfolios
- Supports multiple currencies and automatic currency conversion
- Alarms and notifications
- The Wyden UI can easily be integrated into corporate IT infrastructures even with strict firewall rules, VPNs, and remote locations
Trading view chart
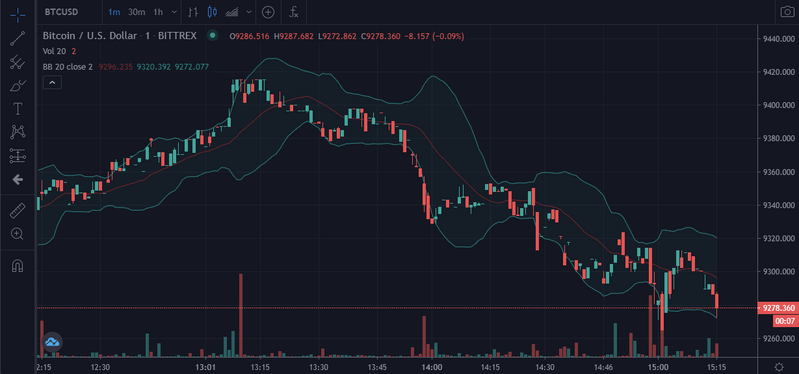
The Wyden frontend also comes with the highly interactive TradingView Real-Time Chart Widget.
- You can choose to either use TradingView’s historical data in the chart or the data from any of the supported historical data providers inside Wyden
- TradingView has regular and advanced chart types, each one helps analyze the market at a different angle (e.g., Bars, Line, Candles, Renko, Area, etc.)
- TradingView comes with a massive library of over 100 prebuilt technical indicators for an in-depth market analysis, covering the most popular trading concepts and indicators (e.g., ATR, Bollinger Bands, Chaikin, CCI, Donchian, Keltner, MACD, Exponential Moving Average, Parabolic SAR, RSI, etc.)
- Drawing tools help you understand how market prices are evolving. You can write on your chart or add freehand drawings, drag simple trend lines from A to B, apply the widespread Fibonacci and Gann tools, or apply the popular Elliot Waves
- Comparing an instrument to the benchmark index is a great way to gauge its performance – to see if it’s doing better or worse than the industry. TradingView lets you compare any instrument to any index or any other instrument based on % change since the starting point
- It’s often useful to search for relationships between different instruments – do they move in tandem or always in opposite directions? With TradingView, you can look at different instruments on the same chart, even if one trades at $1000 and another one trades at $1
- TradingView lets you set the price scales to match your type of analysis. There are linear, percent, and log axes for drastic price movements. You can even use two separate price scales at the same time: one for indicators and one for price movements
Full level 2 order book
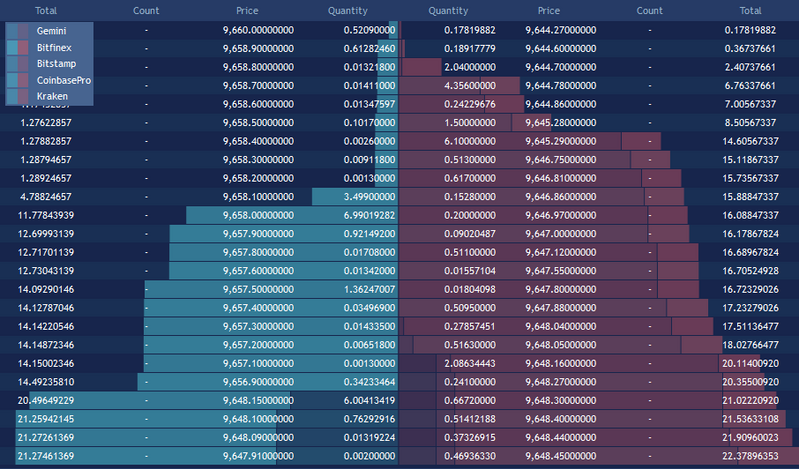
The Wyden frontend integrates a full level 2 order book including:
- Full order book for all adapters/exchanges
- Aggregated order book across exchanges to see a combined view of currently available liquidity
Exchange balances UI
The Wyden UI visualizes balances held on external venues such as exchanges and custodians. All assets across connected venues are listed as both a table and a pie chart. Dynamic aggregations are available by wallet type, account and asset. Through connected custody systems, it is possible to initiate a blockchain transfer between any two connected wallets.
Wyden supports both internal balances related to internal portfolios and external balances on exchanges. In combination, the two perspectives allow for completely new use cases such as:
- Giving banking clients access to their portfolio balances and positions while executing orders through a multitude of external venues, thus managing the bank’s capital efficiently across connected venues
Trading data and performance visualizations
Wyden includes the following visualization capabilities based on InfluxDB and Grafana.
- Portfolio reporting: Allows users to configure and visualize real-time graphs with the ability to dynamically aggregate values across a group of portfolios or drill down into a single portfolio. Performance reports are based on the integrated InfluxDB historical database using Flex queries for fast and accurate reporting. Real-time performance reports are available for the following key metrics:
- P&L over time
- Cash Balances
- Market Value
- Net Liquidation Value
- Open Positions
- Realized P&L
- Unrealized P&L
- Custom metrics visualization: Any type of time series-based data can be recorded using InfluxDB and visualized using Grafana. This can for example be utilized for quantitative trading strategies to visualize strategy metrics over time. Or it can be used to visualize time-series data retrieved from external sources (e.g. company fundamentals)
Additional user interfaces
In addition to the HTML5 based frontend, Wyden provides UIs for specialized system areas.
- Reference data manager (RDM) to reference data like instruments, accounts, exchanges, and holidays can be edited through a user-friendly interface or automatically downloaded from external reference data providers
- Through the historical data manager (HDM) historical data can be downloaded, viewed, and edited. The HDM also supports exporting and importing historical data in different file formats
- Custom HTML5 user interface with quant strategy specific custom widgets allowing users to visualize strategy-specific data or interact with strategy-specific functionality (e.g. modify parameters or change the state of a strategy)
Go back to the features overview.


